


Invited Speakers
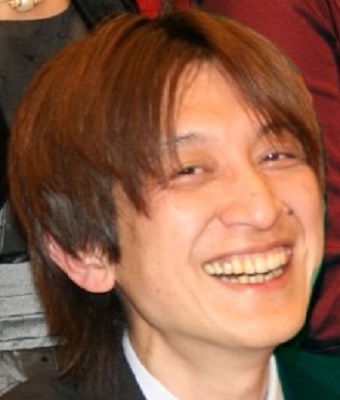 Speaker: Takayuki Itoh (Professor, Ochanomizu University, Japan)
Title: Key-node-separated graph clustering and visualization
Abstract: This talk presents a graph visualization technique which applies a graph clustering algorithm taking into account the combination of connections and attributes. The graph clustering step divides the nodes according to the commonality of connected nodes and similarity of feature value vectors. It then calculates the distances between arbitrary pairs of clusters according to the number of connecting edges and similarity of feature value vectors, and finally places the clusters based on the distances. Consequently, the technique separates important nodes which have connections to multiple large clusters, and improves the visibility of connections of such nodes. This talk presents examples with a co-authorship network dataset, and some recent on-going extensions.
Bio: Takayuki Itoh is a full professor of the department of information sciences in Ochanomizu University. He was the director of the society for art and science in Japan during 2014 to 2016, track co-chair of ACM Symposium on Applied Computing, Multimedia and Visualization track during 2012 to 2015, and organization chair of IEEE Pacific Visualization 2014. He will be the general chair of IEEE Pacific Visualization in 2018, student volunteer chair of ACM Intelligent User Interface conference in 2018, and the director of SIG on interactive system and software in Japan in 2018 and 2019. He has received his B.S., M.S., and Ph.D. degrees from Waseda University in 1990, 1992, and 1997, respectively. He has been a researcher at Tokyo Research Laboratory of IBM Japan during 1992 to 2005. His interest includes scientific and information visualization, graph drawing, multimedia user interface, music computing, and computer graphics.
Speaker: Takayuki Itoh (Professor, Ochanomizu University, Japan)
Title: Key-node-separated graph clustering and visualization
Abstract: This talk presents a graph visualization technique which applies a graph clustering algorithm taking into account the combination of connections and attributes. The graph clustering step divides the nodes according to the commonality of connected nodes and similarity of feature value vectors. It then calculates the distances between arbitrary pairs of clusters according to the number of connecting edges and similarity of feature value vectors, and finally places the clusters based on the distances. Consequently, the technique separates important nodes which have connections to multiple large clusters, and improves the visibility of connections of such nodes. This talk presents examples with a co-authorship network dataset, and some recent on-going extensions.
Bio: Takayuki Itoh is a full professor of the department of information sciences in Ochanomizu University. He was the director of the society for art and science in Japan during 2014 to 2016, track co-chair of ACM Symposium on Applied Computing, Multimedia and Visualization track during 2012 to 2015, and organization chair of IEEE Pacific Visualization 2014. He will be the general chair of IEEE Pacific Visualization in 2018, student volunteer chair of ACM Intelligent User Interface conference in 2018, and the director of SIG on interactive system and software in Japan in 2018 and 2019. He has received his B.S., M.S., and Ph.D. degrees from Waseda University in 1990, 1992, and 1997, respectively. He has been a researcher at Tokyo Research Laboratory of IBM Japan during 1992 to 2005. His interest includes scientific and information visualization, graph drawing, multimedia user interface, music computing, and computer graphics.
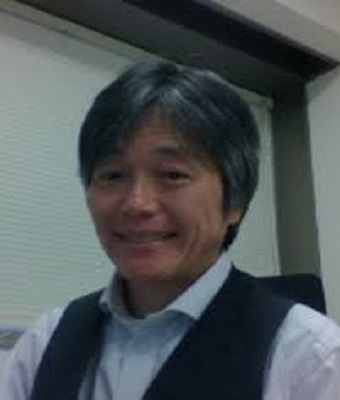 Speaker: Koji Koyamada (Professor, Kyoto University, Japan)
Title: Visual Causality Exploration and its applications
Abstract: Recently, big data is hot topic and trends that nearly everyone follows, analyzes and celebrates for its unlimited power. Every second, unlimited unstructured data is generated by users with clicks, typing and browsing. As big and open data, we can pick up a large dataset from scientific research, social media and public government such as weather, GPS, Census, security and healthcare. In the big data era, it is expected that every citizen can access the open data and participate in a scientific research. For realizing such a data science, visualization techniques will play an important role since they will enable the big data to be transmitted to the brain efficiently. It is highly expected for visualization to facilitate an exploration of a causality in a data science field. Although it is possible to calculate a correlation between data items (variables) by using a statistic method, the causality is a feature which domain experts can clarify by making the best of their professional knowledge. There are several examples of illogically inferring causation from correlation. That is why a visualization plays an important role in the scientific discovery. In this talk, we would like to introduce our activities on visual causality exploration. They include an interactive specification of a latent variable which explains several observable variables by using a causality graph in a phenotypic expression network, and an interactive exploration of a causality between two time-varying variables defined on computational grids.
Bio: Prof. Koji Koyamada is currently a professor at the Academic Center for Computing and Media Studies, Kyoto University, Japan. His research interest includes modeling & simulation and visualization. He is an associate member of the Science Council of Japan, a former president of the Visualization Society Japan, and a former president of Japan Society of Simulation Technology. He received the IEMT/IMC outstanding paper award in 1998, the VSJ contribution award in 2009 and the VSJ outstanding paper award in 2010. He received his B.S., M.S. and Ph.D. degrees in electronic engineering from Kyoto University, Japan in 1983, 1985 and 1994, respectively, and worked for IBM Japan from 1985 to 1998. From 1998 to 2001 he was an associate professor at the Iwate Prefectural University, Japan. From 2001 to 2003, he was an associate professor at Kyoto University, Japan.
Speaker: Koji Koyamada (Professor, Kyoto University, Japan)
Title: Visual Causality Exploration and its applications
Abstract: Recently, big data is hot topic and trends that nearly everyone follows, analyzes and celebrates for its unlimited power. Every second, unlimited unstructured data is generated by users with clicks, typing and browsing. As big and open data, we can pick up a large dataset from scientific research, social media and public government such as weather, GPS, Census, security and healthcare. In the big data era, it is expected that every citizen can access the open data and participate in a scientific research. For realizing such a data science, visualization techniques will play an important role since they will enable the big data to be transmitted to the brain efficiently. It is highly expected for visualization to facilitate an exploration of a causality in a data science field. Although it is possible to calculate a correlation between data items (variables) by using a statistic method, the causality is a feature which domain experts can clarify by making the best of their professional knowledge. There are several examples of illogically inferring causation from correlation. That is why a visualization plays an important role in the scientific discovery. In this talk, we would like to introduce our activities on visual causality exploration. They include an interactive specification of a latent variable which explains several observable variables by using a causality graph in a phenotypic expression network, and an interactive exploration of a causality between two time-varying variables defined on computational grids.
Bio: Prof. Koji Koyamada is currently a professor at the Academic Center for Computing and Media Studies, Kyoto University, Japan. His research interest includes modeling & simulation and visualization. He is an associate member of the Science Council of Japan, a former president of the Visualization Society Japan, and a former president of Japan Society of Simulation Technology. He received the IEMT/IMC outstanding paper award in 1998, the VSJ contribution award in 2009 and the VSJ outstanding paper award in 2010. He received his B.S., M.S. and Ph.D. degrees in electronic engineering from Kyoto University, Japan in 1983, 1985 and 1994, respectively, and worked for IBM Japan from 1985 to 1998. From 1998 to 2001 he was an associate professor at the Iwate Prefectural University, Japan. From 2001 to 2003, he was an associate professor at Kyoto University, Japan.
 Speaker: Issei Fujishiro (Professor, Keio University, Japan)
Title: Facilitating sparse modeling with sophisticated visual analysis tools
Abstract: During FY2013-2018, we have a governmental project under a Grant-in-Aid for Scientific Research on Innovative Areas called “Initiative for High-Dimensional Data-Driven Science through Deepening of Sparse Modeling” (http://sparse-modeling.jp/index_e.html). In this project, I have been heading a planned visualization research project with a primary goal to construct a visualization platform for understanding the behavior of given high-dimensional data in physical space by projecting it onto a designated information space. For this purpose, we transform relatively low-dimensional data obtained through sparse modeling to two, three, or four-dimensional space where we can fully visualize the characteristics of the original high-dimensional data. The idea behind our project is to establish an interactive model called human-in-the-loop by incorporating visual feedback from the users in the analysis of high-dimensional data based on sparse modeling. In this talk, I will give an overview of the governmental project and introduce recent research results from the planned research project, including spectral-based contractible parallel coordinate plots, Biclustering multivariate data for correlated subspace mining, and TimeTubes for visualizing polarization variations in blazars.
Bio: Issei Fujishiro received his Doctor of Science in information sciences from the University of Tokyo in 1988. Fujishiro started his career as a Research Associate at the University of Tokyo in 1985, and then worked as a faculty member for University of Tsukuba, Ochanomizu University, and Tohoku University before joining Keio University in 2009, where he is currently Head Professor of Center for Information and Computer Science, Graduate School of Science and Technology, Yokohama. He was elected as an honorable alumnus from Keio University in 2015. He stayed as a Visiting Professor of Computer Science at the State University of New York at Stony Brook, USA during 1994 to 1995. His current research interests include applied visualization design and lifecycle management, and smart ambient media with multi-modal information display. He has served on the editorial boards for several academic journals, including IEEE Transactions on Visualization and Computer Graphics (1999-2003), Elsevier Computers & Graphics (2003-2013), and Elsevier Visual Informatics (2016 to date). He has served as a Steering Committee member for IEEE Scientific Visualization, IEEE PacificVis, and NICOGRAPH International. He served as a Program Chair for IEEE/Eurographics Volume Graphics 2003/2005, IEEE PacificVis 2008, ACM VRCAI 2014, and TopoInVis 2017; and chaired many international conferences, including IEEE SMI 2006, Cyberworlds 2013, IEEE PacificVis 2014, ACM VRCAI 2015, CGI 2017, and IEEE PacificVAST2018. Fujishiro is currently serving on the board directors for Japan Federation of Engineering Societies and International Information Science Foundation, and on the board of trustees for Computer Graphic Arts Society.
Speaker: Issei Fujishiro (Professor, Keio University, Japan)
Title: Facilitating sparse modeling with sophisticated visual analysis tools
Abstract: During FY2013-2018, we have a governmental project under a Grant-in-Aid for Scientific Research on Innovative Areas called “Initiative for High-Dimensional Data-Driven Science through Deepening of Sparse Modeling” (http://sparse-modeling.jp/index_e.html). In this project, I have been heading a planned visualization research project with a primary goal to construct a visualization platform for understanding the behavior of given high-dimensional data in physical space by projecting it onto a designated information space. For this purpose, we transform relatively low-dimensional data obtained through sparse modeling to two, three, or four-dimensional space where we can fully visualize the characteristics of the original high-dimensional data. The idea behind our project is to establish an interactive model called human-in-the-loop by incorporating visual feedback from the users in the analysis of high-dimensional data based on sparse modeling. In this talk, I will give an overview of the governmental project and introduce recent research results from the planned research project, including spectral-based contractible parallel coordinate plots, Biclustering multivariate data for correlated subspace mining, and TimeTubes for visualizing polarization variations in blazars.
Bio: Issei Fujishiro received his Doctor of Science in information sciences from the University of Tokyo in 1988. Fujishiro started his career as a Research Associate at the University of Tokyo in 1985, and then worked as a faculty member for University of Tsukuba, Ochanomizu University, and Tohoku University before joining Keio University in 2009, where he is currently Head Professor of Center for Information and Computer Science, Graduate School of Science and Technology, Yokohama. He was elected as an honorable alumnus from Keio University in 2015. He stayed as a Visiting Professor of Computer Science at the State University of New York at Stony Brook, USA during 1994 to 1995. His current research interests include applied visualization design and lifecycle management, and smart ambient media with multi-modal information display. He has served on the editorial boards for several academic journals, including IEEE Transactions on Visualization and Computer Graphics (1999-2003), Elsevier Computers & Graphics (2003-2013), and Elsevier Visual Informatics (2016 to date). He has served as a Steering Committee member for IEEE Scientific Visualization, IEEE PacificVis, and NICOGRAPH International. He served as a Program Chair for IEEE/Eurographics Volume Graphics 2003/2005, IEEE PacificVis 2008, ACM VRCAI 2014, and TopoInVis 2017; and chaired many international conferences, including IEEE SMI 2006, Cyberworlds 2013, IEEE PacificVis 2014, ACM VRCAI 2015, CGI 2017, and IEEE PacificVAST2018. Fujishiro is currently serving on the board directors for Japan Federation of Engineering Societies and International Information Science Foundation, and on the board of trustees for Computer Graphic Arts Society.