Introduction
The China-Japan Joint Visualization Workshop aims to bring together visualization researchers in China and Japan to share their recent work on emerging topics in Visualization. The objective of the workshop is to promote the greater exchange of research, and to explore collaboration opportunities in the development of visualization and visual analytics between the two countries. In the past, the workshop was successfully held in Beijing, China (2017), Kobe, Japan (2018), and Chengdu, China (2019).
The 4th China-Japan Joint Visualization Workshop will be held in Wuhan, China on July 24, 2021. The workshop will be organized in the form of invited talks and panel discussions. We invite researchers from both Japan and China to attend this workshop and share their research, insight and experience.
Local Organizers (List in Alphabetical Order):
- Chongke Bi (Tianjin University)
- Lingyun Yu(Xi'an Jiaotong-Liverpool University)
- Le Liu(Northwestern Polytechnical University)
- Wei Zeng(Shenzhen Institute of Advanced Technology, CAS)
Co-Organizer (List in Alphabetical Order):
- Baoqing Wang (Keio University)
- Gang Liu (China University of Geosciences)
- Issei Fujishiro (Keio University)
- Jiawan Zhang (Tianjin University)
- Jun Tao (Sun Yat-sen University)
- Kazuo Misue (University of Tsukuba)
- Koji Koyamada (Kyoto University)
- Naohisa Sakamoto (Kobe University)
- Shen Ying (Wuhan University)
- Shigeo Takahashi (University of Aizu)
- Takayuki Itoh (Ochanomizu University)
- Xiaoru Yuan (Peking University)
- Yume Asayama (Keio University)
Schedule
Time:July 24th 08:30-11:30 Beijing Time (UTC+8)
| Time | Title | Speaker | Session Chair | |
|---|---|---|---|---|
| 08:30 - 08:35 | Opening | Xiaoru Yuan | ||
| 08:35 - 08:55 | FORSETI and THEMIS: Visual Analysis Environments for Computational Forensics | Baoqing Wang, Yume Asayama, Issei Fujishiro | Chongke Bi | |
| 08:55 - 09:15 | Visual Analysis of Geospatial Multivariate Data for Investigating Radioactive Deposition Processes | Shigeo Takahashi | ||
| 09:15 - 09:35 | Smart In-situ Visualization for Large-scale Numerical Simulations Aiming at Efficient Knowledge Acquisition | Naohisa Sakamoto | ||
| 09:35 - 09:45 | Break | |||
| 09:45 - 10:05 | Visualization of Discrete Data Using Neural Networks | Koji Koyamada | Wei Zeng | |
| 10:05 - 10:25 | Application and Evaluation of Hierarchical Graph Visualization | Takayuki Itoh | ||
| 10:25 - 10:45 | Distortion and Correction of Color Spaces | Kazuo Misue | ||
| 10:45 - 11:25 | Discussion: Speakers from Japan Scholars from China:Xiaoru Yuan,Jiawan Zhang,Gang Liu,Shen Ying,Jun Tao,Chongke Bi,Wei Zeng,Lingyun Yu, Le Liu |
|||
| 11:25 - 11:30 | Closing | Xiaoru Yuan | ||
Speakers


Abstract:Forensic science holds a unique position among all other disciplines due to its important social implications—lying at the intersection of medical science and legal science. Indeed, forensic autopsy reports, which systematically describe autopsy findings, are imperative both for legal medicine and courts. Typically, they are created by medical examiners (MEs) collaboratively working with diagnostic radiologists (DRs). The forensic autopsy reports also serve as underlying legal documents in judicial trials for engaged judicial personnel (JP). A challenging issue is to provide effective computational assistance tools for facilitating the intricate collaborative work involved in the autopsy. For this issue, we design an integrated visual analysis system named FORSETI (forensic autopsy system for e-court instruments) and its auxiliary system called THEMIS (theoretical estimation of meaning of insults). The FORSETI system was designed to empower MEs and DRs to collaborate and author effective forensic autopsy reports by a combination of an extended version of legal medicine mark-up language and autopsy juxtaposition. On the other hand, the THEMIS system helps MEs and DRs as well as JP determine the cause of death by computing the context-sensitive similarities of surface wounds based on the Mathematical Model of Meaning. In this talk, we will clarify the forensic autopsy objectives and their corresponding computational tasks and give an overview of both systems. Prospective research and development issues are also discussed.
Short Bio:Baoqing Wang is currently a Ph. D. candidate at Graduate School of Science and Technology, Keio University, Yokohama, Japan. He received his B.E. and M.E. in School of Mechanical Engineering from Tianjin University of Technology in 2016 and 2019, respectively. His main research interests include biomedical visualization.
Yume Asayama is currently a master course student at the Center for Information and Computer Science, Graduate School of Science and Technology, Keio University, Yokohama, Japan. She received her bachelor degree in engineering from the same university in 2020. Her field of study is computational forensics. She earned the Student Encouragement Award at the 82nd National Congress of the Information Processing Society of Japan.
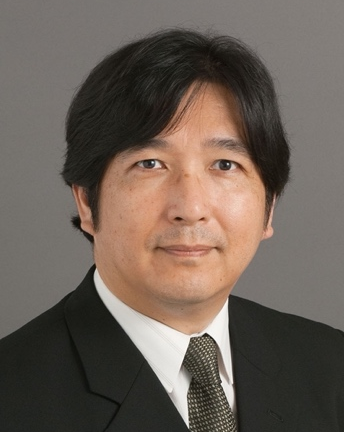
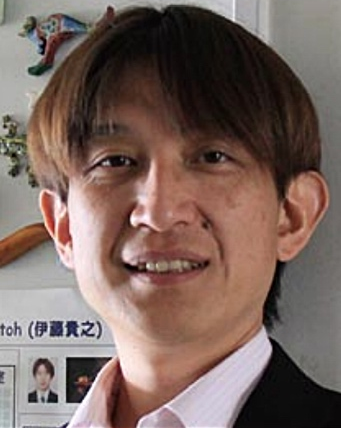
Issei Fujishiro is currently a professor of information and computer science at Keio University, Yokohama, Japan. He holds an adjunct position at School of Computer Science, Hangzhou Dianzi University, Hangzhou, China. He received his Doctor of Science in information sciences from the University of Tokyo in 1988. His research interests include modeling paradigms and shape representations, applied visualization design and lifecycle management, and smart ambient media with multi-modal displays. He co-founded IEEE PacificVis and has been serving on the steering committee for the symposia. He served as a SciVis paper co-chair for IEEE VIS 2018/2019 and has been serving as an associate editor for IEEE TVCG and Elsevier Journal of Visual Informatics. He is a Vice President of the Visualization Society of Japan, an honorary member of IIEEJ, a fellow of JFES and IPSJ, and a senior member of IEEE and ACM, and a member of Science Council of Japan.

Abstract:This talk presents our application study for investigating radioactive deposition processes through visual analysis of geospatial multivariate data. The Fukushima Daiichi Nuclear Power Plant (FDNPP) accident in 2011 raised awareness of the importance of radioactive deposition processes, especially for proposing aerosol measures against possible air pollution. However, identifying the types of deposition processes often results in difficult tasks due to complicated terrains around the FDNPP. Therefore, we developed an approach for interactively investigating the correspondence of the geospatial positions to the air dose rate along with relevant attributes. Our idea is to compose a set of scatterplots for pairwise attributes, onto which we project terrain surfaces to find specific patterns of such attributes. We applied our approach to the visual analysis of air dose distribution data around FDNPP after the accident and clearly distinguished contamination areas derived from different deposition processes. This is joint work with Japan Atomic Energy Agency and Kyushu University.
Short Bio:Shigeo Takahashi is currently a professor in the School of Computer Science and Engineering at the University of Aizu, Japan and also serving as the director of research center for advanced information science and technology. He received his B.S., M.S., and Ph.D. in computer science from the University of Tokyo in 1992, 1994, and 1997, respectively. His research interests include scientific and information visualization, visual perception modeling, geographic/cartographic visualization, and geometric modeling. He is currently serving as an associate editor of the journal "Computational Visual Media." He received the Most Cited Paper Award for Graphical Models (2004-2006) in 2007 from Elsevier.

Abstract:In recent years, in-situ visualization has been attracting attention as a method to compensate for the shortcomings of visualization for large-scale numerical simulations at supercomputer scale, in which the simulation and visualization are performed simultaneously. However, it requires a lot of time and effort to confirm interesting phenomena from a large number of images visualized against the simulation results calculated with high accuracy, because the visualization method and rendering viewpoint for the process must be set in advance. In our research group, we are developing a method that can efficiently identify the spatio-temporal region to be visualized by automatically evaluating the state changes for the simulation dataset to be calculated. This method enables us to efficiently visualize important clues for scientific analysis and interpretation of phenomena reproduced by numerical simulations, and to reduce not only the imaging time in in-situ visualization but also the time required to obtain scientific knowledge from numerical data. We are aiming to realize smart in-situ visualization. In this talk, I will talk on my research group's past efforts and latest research results on in-situ visualization.
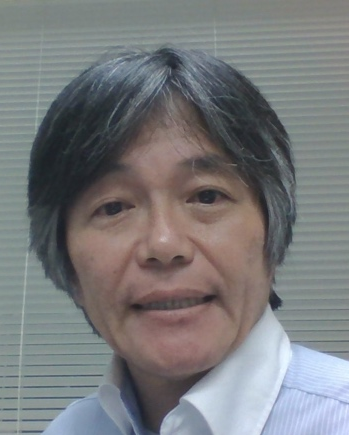
Short Bio:Naohisa Sakamoto is an associate professor of the Graduate School of System Informatics at Kobe University. He received the Ph.D. degree in Graduate School of Engineering from Kyoto University in 2007. From 2001 to 2003, he worked in KGT (Kubota Graphics Technology) in Japan. His research interests include scientific visualization and visual analytics. He is a member of the Institute of Electronics, Information and Communication Engineers, the Visualization Society of Japan, Japan Society for Simulation Technology, and the IEEE Computer Society.
Abstract:In this talk, we describe a method of constructing a neural network (NN) model from discrete data in a spatiotemporal space based on the property that NN can universally approximate arbitrary functions. Using this model, a technique of visualizing the discrete data sampled in numerical simulation datasets will be described. We will show application examples with this technique.
Short Bio:Prof. Koji Koyamada is currently a professor at the Academic Center for Computing and Media Studies, Kyoto University, Japan. His research interest includes modeling & simulation and visualization. He is a member of the Science Council of Japan, a former president of the Visualization Society Japan, and a former president of Japan Society of Simulation Technology. He received the IEMT/IMC outstanding paper award in 1998, the VSJ contribution award in 2009 and the VSJ outstanding paper award in 2010. He received his B.S., M.S. and Ph.D. degrees in electronic engineering from Kyoto University, Japan in 1983, 1985 and 1994, respectively, and worked for IBM Japan from 1985 to 1998. From 1998 to 2001 he was an associate professor at the Iwate Prefectural University, Japan. From 2001 to 2003, he was an associate professor at Kyoto University, Japan.
Abstract:This talk introduces the speaker's studies on hierarchical graph visualization. The former part of the talk introduces a technique for key-node-separated graph clustering and layout and its application to the visualization of the human-relationship network. The latter part introduces new evaluation metrics for hierarchical graph visualization based on sparseness and cluttering.
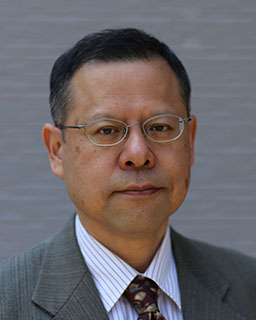
Short Bio:Takayuki Itoh is a full professor of Ochanomizu University, Japan. He received his Ph.D. degree from Waseda University in 1997. He was a researcher of IBM Research, Tokyo Research Laboratory from 1992 to 2005. He moved to Ochanomizu University as an associate professor in 2005 and then has been a full professor since 2011. He is mainly working on information visualization, especially graph, hierarchical, and multidimensional data visualization, but also he has many publications in other fields including scientific visualization, computer graphics, and music computing.
Abstract:Colors are convenient visual variables in data visualization and play an important role in data representation. However, there are several situations where colors are used inappropriately to represent quantitative data. Possible reasons could be the lack of knowledge of color spaces and the difficulty of developing color ramps that consider color differences. In this talk, I will introduce two kinds of tools to encounter such problems. One is a tool to help understand color spaces and color differences. The tool displays cross-sections of color spaces and presents polygons representing color differences in the cross-sections. By using this tool, it is possible to understand the distortion of a color space against human visual characteristics. The other is a tool to support the development of color ramps to represent quantitative data. The tool helps develop color ramps with uniform color differences by selecting colors from a specified color path (continuous straight lines or curved lines) in a color space at equal intervals according to some color difference formula.
Short Bio:Kazuo Misue is a Professor at Department of Computer Science, University of Tsukuba, Japan. He performs research and development on information technology. His research interests include human-computer interaction, information visualization, automatic graph drawing. He received a BSc and an MSc from Tokyo University of Science in 1984 and 1986. He received a Ph.D. in engineering from the University of Tokyo in 1997.