COVID-19 Visual Analytics
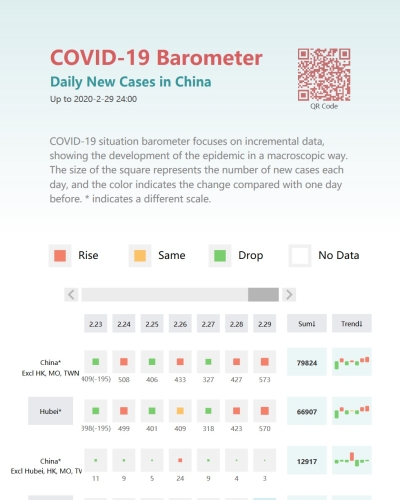
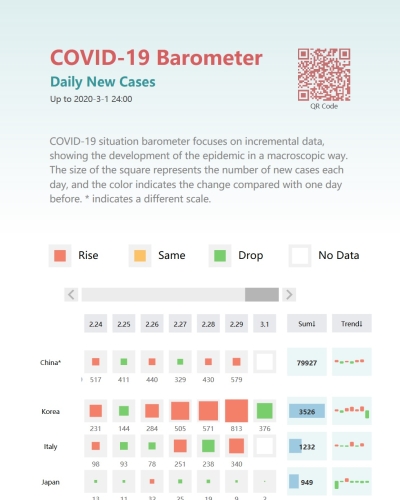
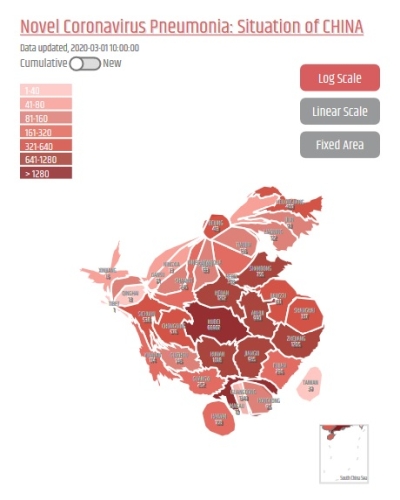
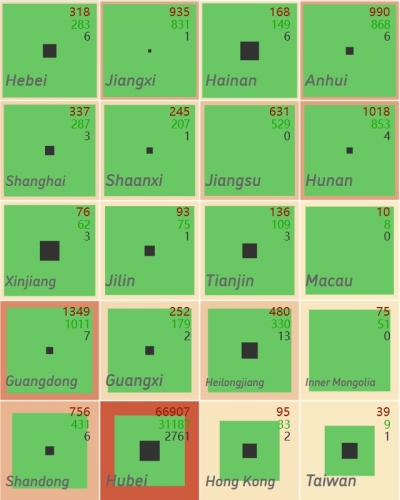
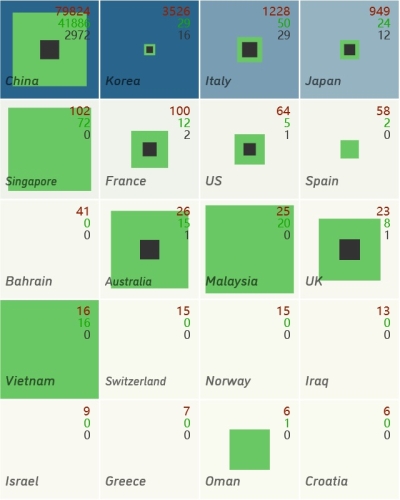
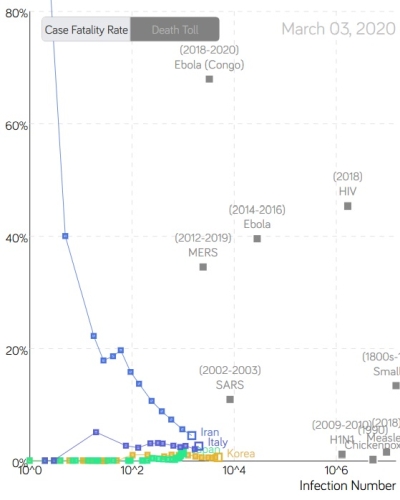
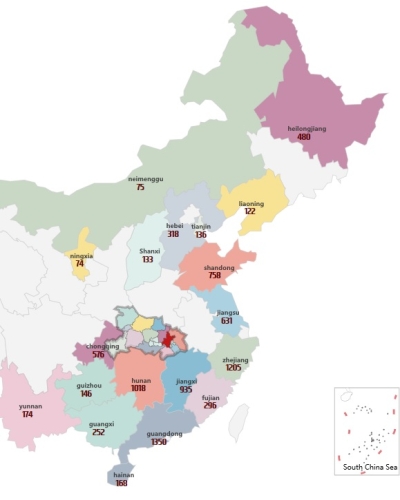
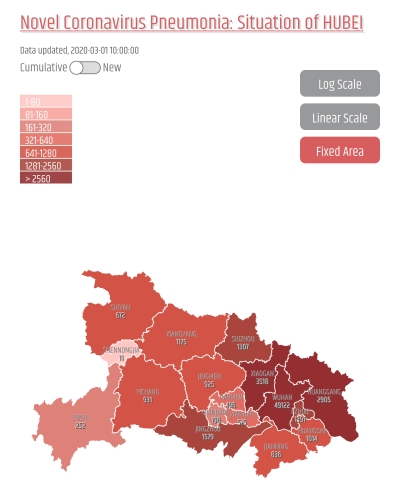
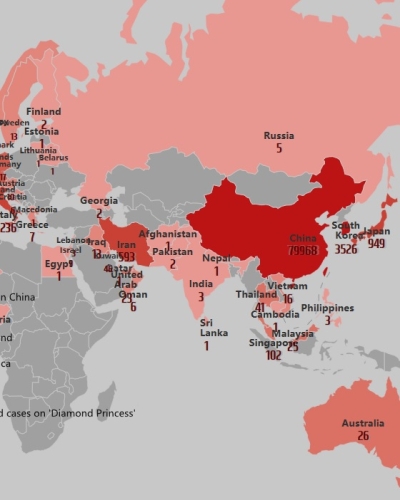
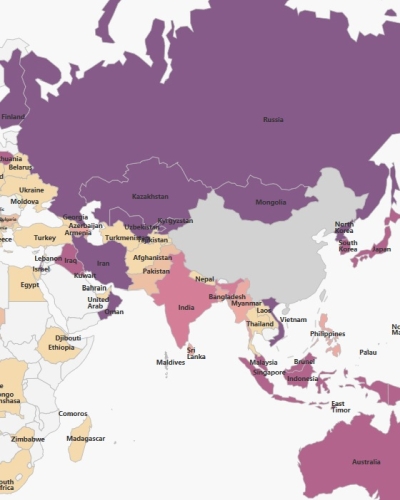
At the end of 2019, COVID-19 caused by SARS-CoV-2 outbroke and spread globally. After obtaining some public data, we started some visualization projects, hoping that they could help people to understand the epidemic, and be more confident for the future.
Copyright
Those softwares and visual effects are developed by Visualization and Visual Analytics Group. Copyright belongs to Peking University.
It is welcome and free to utilize or reprint our visualizations of COVID-19 for the public interest, but please do contact us and indicate the source beforehand. We oppose commercial piracy and hold our rights to give the authorization of displaying our work on other platforms. The media are obligated to apply for permission formally in written before using related visualizations by PKU Visualization and Visual Analytics Group. For other purposes, please also contact us through email.
Mail: pkuvis [at] pku.edu.cn
Acknowledgement
Thank UCloud and Qi An Xin for providing servers to build mirror sites.
